Key Takeaways
- Technical analysis looks at past prices and trading volume to estimate where crypto prices might go next.
- Traders use indicators and chart patterns to find possible entry and exit points.
- Charts are just one tool, so smart traders combine them with strong risk management and a clear plan.
Technical analysis focuses on what the market has already done, not what a project promises to do. It is the study of historical price and volume to anticipate future price moves.
Instead of digging into a crypto’s whitepaper, team, or technology, technical analysis assumes that all available information is already included in the current price. By studying charts, you try to read market psychology, spot recurring patterns, and react to them with a consistent strategy.
The foundation of market analysis
Modern technical analysis traces back to the late 1800s and Charles Dow, co‑founder of Dow Jones & Company and creator of the first stock market index.
His ideas grew into what we now call Dow Theory, which sits on a few core principles.
First, the market discounts everything. The current price reflects all known information, expectations, and sentiment.
Second, markets move in trends. In a bull trend, prices tend to rise over time. In a bear trend, they tend to fall. These trends usually keep going until there is clear evidence that they have reversed.
Finally, volume confirms trends. Strong moves that happen with high trading volume are more likely to be real and sustainable. Weak volume can signal that a trend is fragile and may reverse soon.
Types of cryptocurrency charts
Before you can use technical analysis, you need to understand how prices are shown on a chart.
Crypto traders look at many time frames, from 1‑minute charts for fast trading to daily, weekly, or monthly charts for longer term trends. Most platforms use a few standard chart types.
Line and bar charts
A line chart is the simplest chart. It connects closing prices over time with a single line and helps you see the overall direction of a trend.
A bar chart gives more detail. Each bar shows the open, high, low, and close for a specific time period, such as 1 hour or 1 day. This helps you see how price moved within that period, not just where it ended.
Candlestick charts
Candlestick charts are the most common tool for crypto traders in the US and globally.
Each candlestick shows the open, high, low, and close for a selected time frame. The body of the candle shows the distance between the open and close. The thin lines above and below, called wicks or shadows, show the highest and lowest prices during that period.
Candles are usually colored to show direction. A green (or white) candle means the close was higher than the open, so price went up. A red (or black) candle means the close was lower than the open, so price went down.
Key technical indicators
Technical indicators are math formulas applied to price and volume data. They help traders see momentum, trends, and potential turning points more clearly.
Here are some of the most widely used indicators in crypto trading.
-
Simple Moving Average (SMA)
The SMA is the average closing price over a set number of periods, such as 20 days or 200 days.
It smooths out short term noise and draws a single line on the chart that shows the general trend. -
Exponential Moving Average (EMA)
The EMA is similar to the SMA, but it gives more weight to recent prices.
This makes it react faster when the market changes direction, which some shorter term traders prefer. -
Relative Strength Index (RSI)
The RSI measures the speed and size of recent price changes on a scale from 0 to 100.
A reading above 70 often signals that an asset may be overbought and due for a pullback. A reading below 30 can suggest that it is oversold and may be ready to bounce. -
Bollinger Bands
Bollinger Bands place two bands above and below a moving average, based on volatility. When price touches or moves above the upper band, it can signal that the asset is stretched on the upside. When it touches or drops below the lower band, it can signal a stretched downside.
Traders often watch for price moving back inside the bands as a sign that the move is cooling off. -
Fibonacci Retracement
Fibonacci retracement levels are horizontal lines that suggest where price might pause or reverse during a pullback.
Traders often use common levels such as 38.2%, 50%, and 61.8% of the previous move to guess where support or resistance might appear within a larger trend.
Recognizing chart patterns
Chart patterns are repeated shapes on a chart that many traders believe hint at what could happen next.
They do not guarantee anything. They simply show how price has behaved in similar situations in the past.
-
Support and resistance
Support is a price area where buyers have stepped in before and stopped price from falling further.
Resistance is a price area where sellers have stepped in before and stopped price from climbing higher.
These levels can act like floors and ceilings, although they can break when momentum is strong. -
Trend channels
A trend channel appears when you can draw two parallel lines along price highs and lows.
The upper line marks resistance, and the lower line marks support. As long as price stays within the channel, traders assume the current trend is still in place.
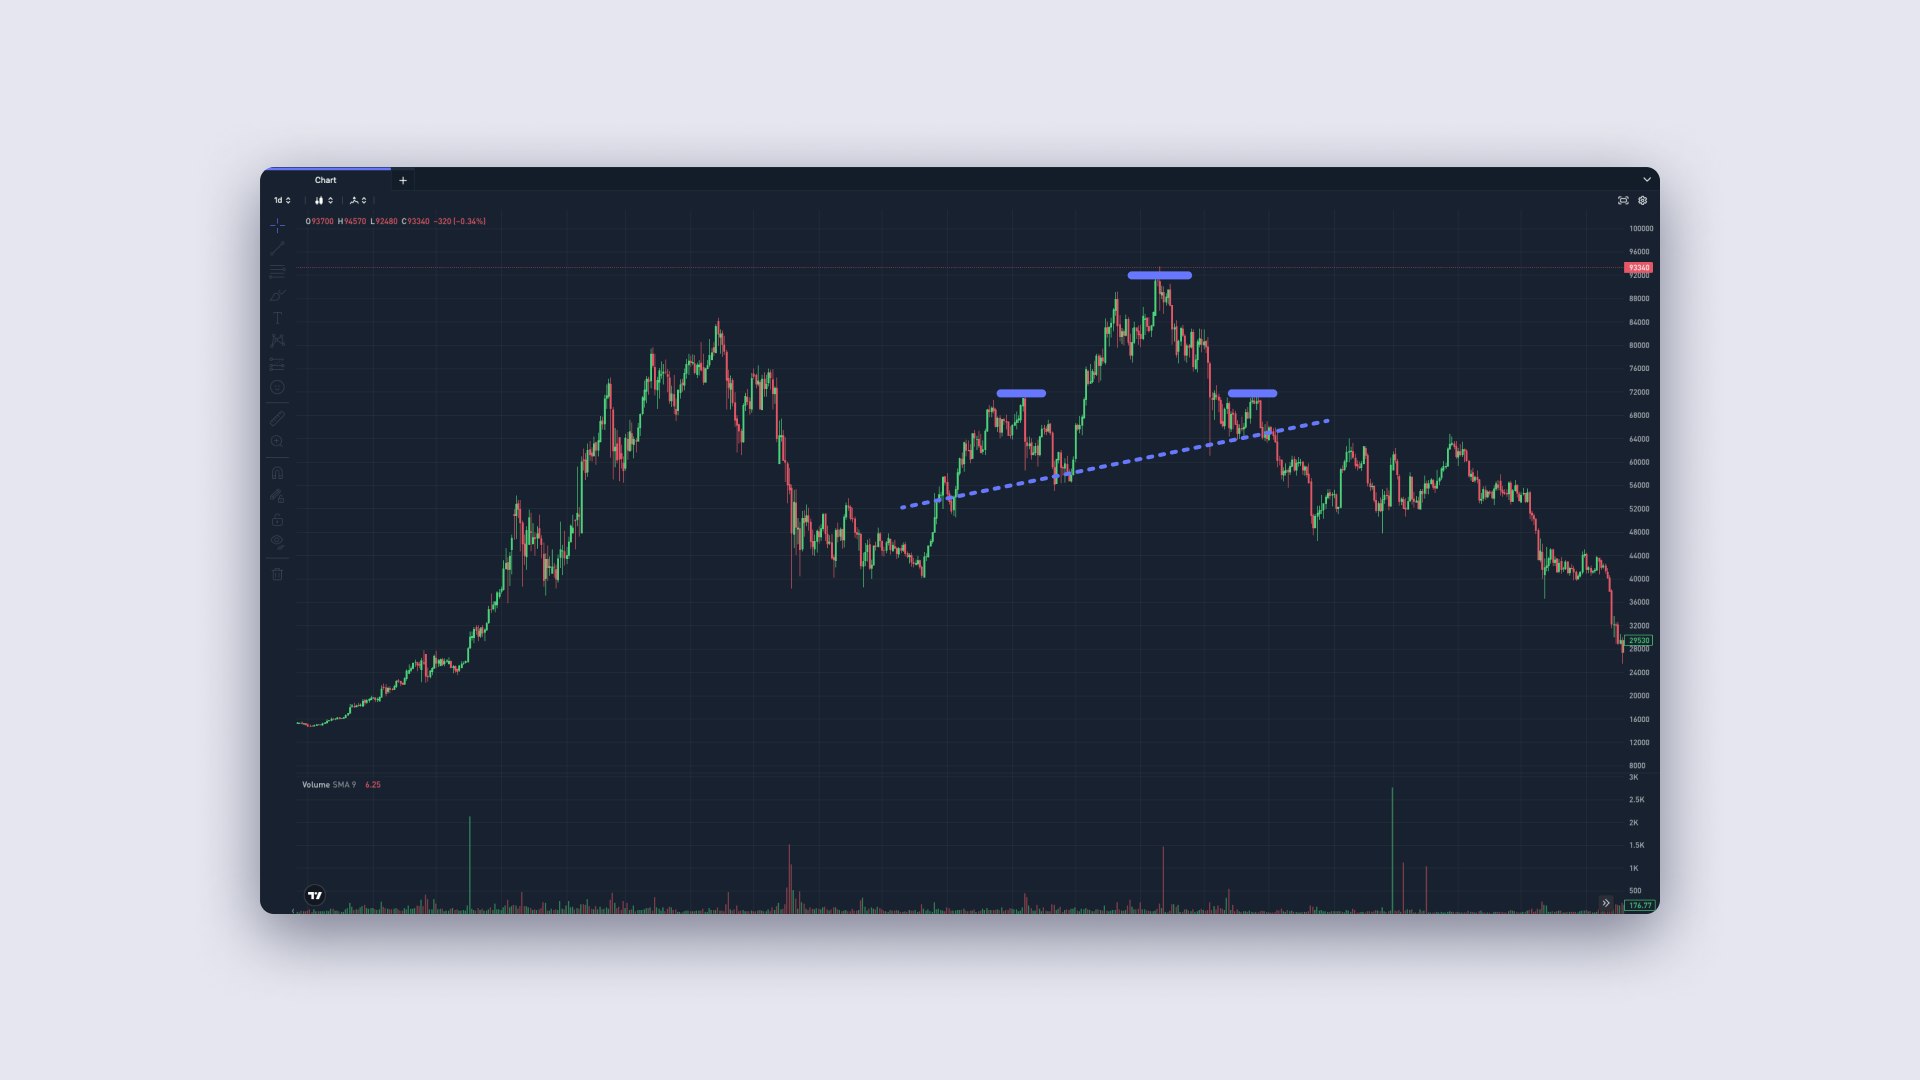
This pattern has three peaks. The middle peak is the highest (the “head”) and the two outer peaks are lower (the “shoulders”).
After the right shoulder fails to make a new high and price breaks below the neckline, traders see it as a sign that an uptrend may be turning into a downtrend.
The inverse head and shoulders has the opposite shape and can signal a possible shift from a downtrend to an uptrend.
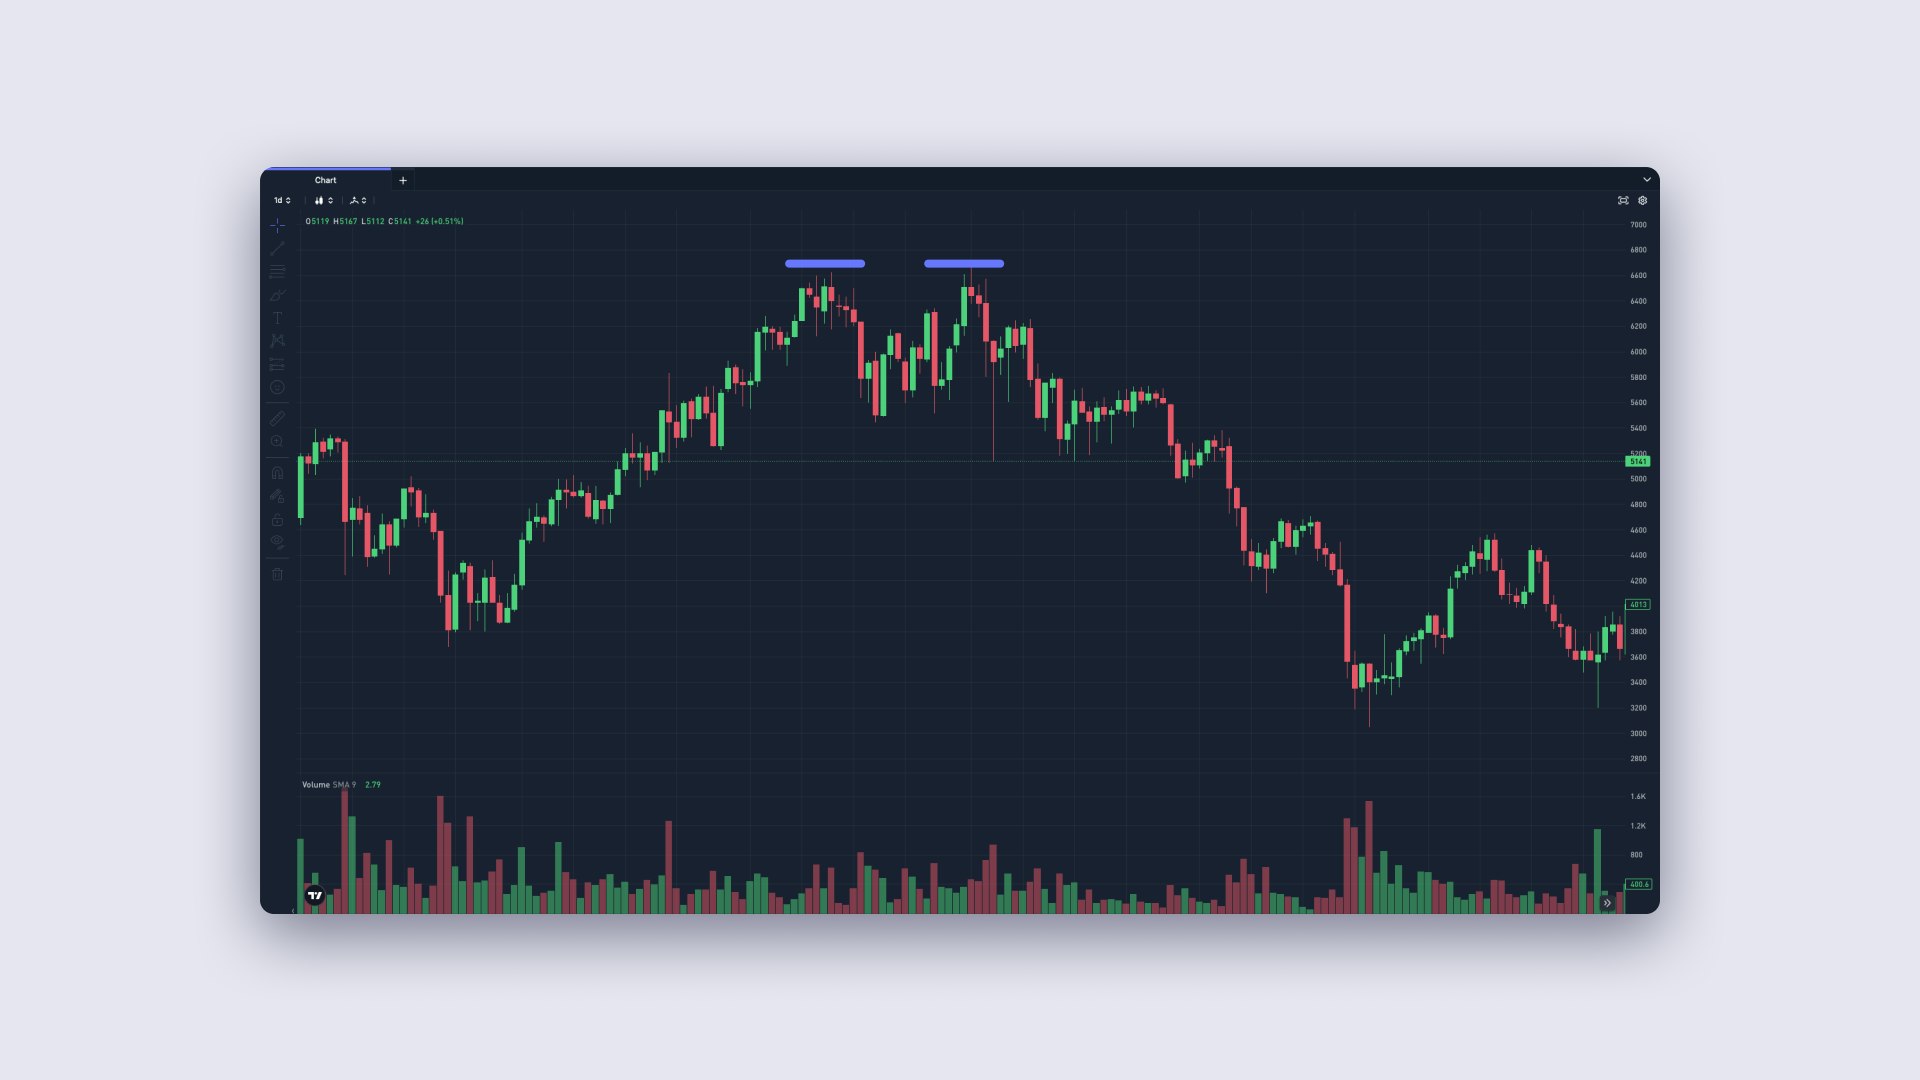
- Double top
A double top looks like the letter M.
Price hits a high, pulls back, then returns to roughly the same high but fails again. When price then breaks below the low between the two peaks, traders often see it as a bearish signal.
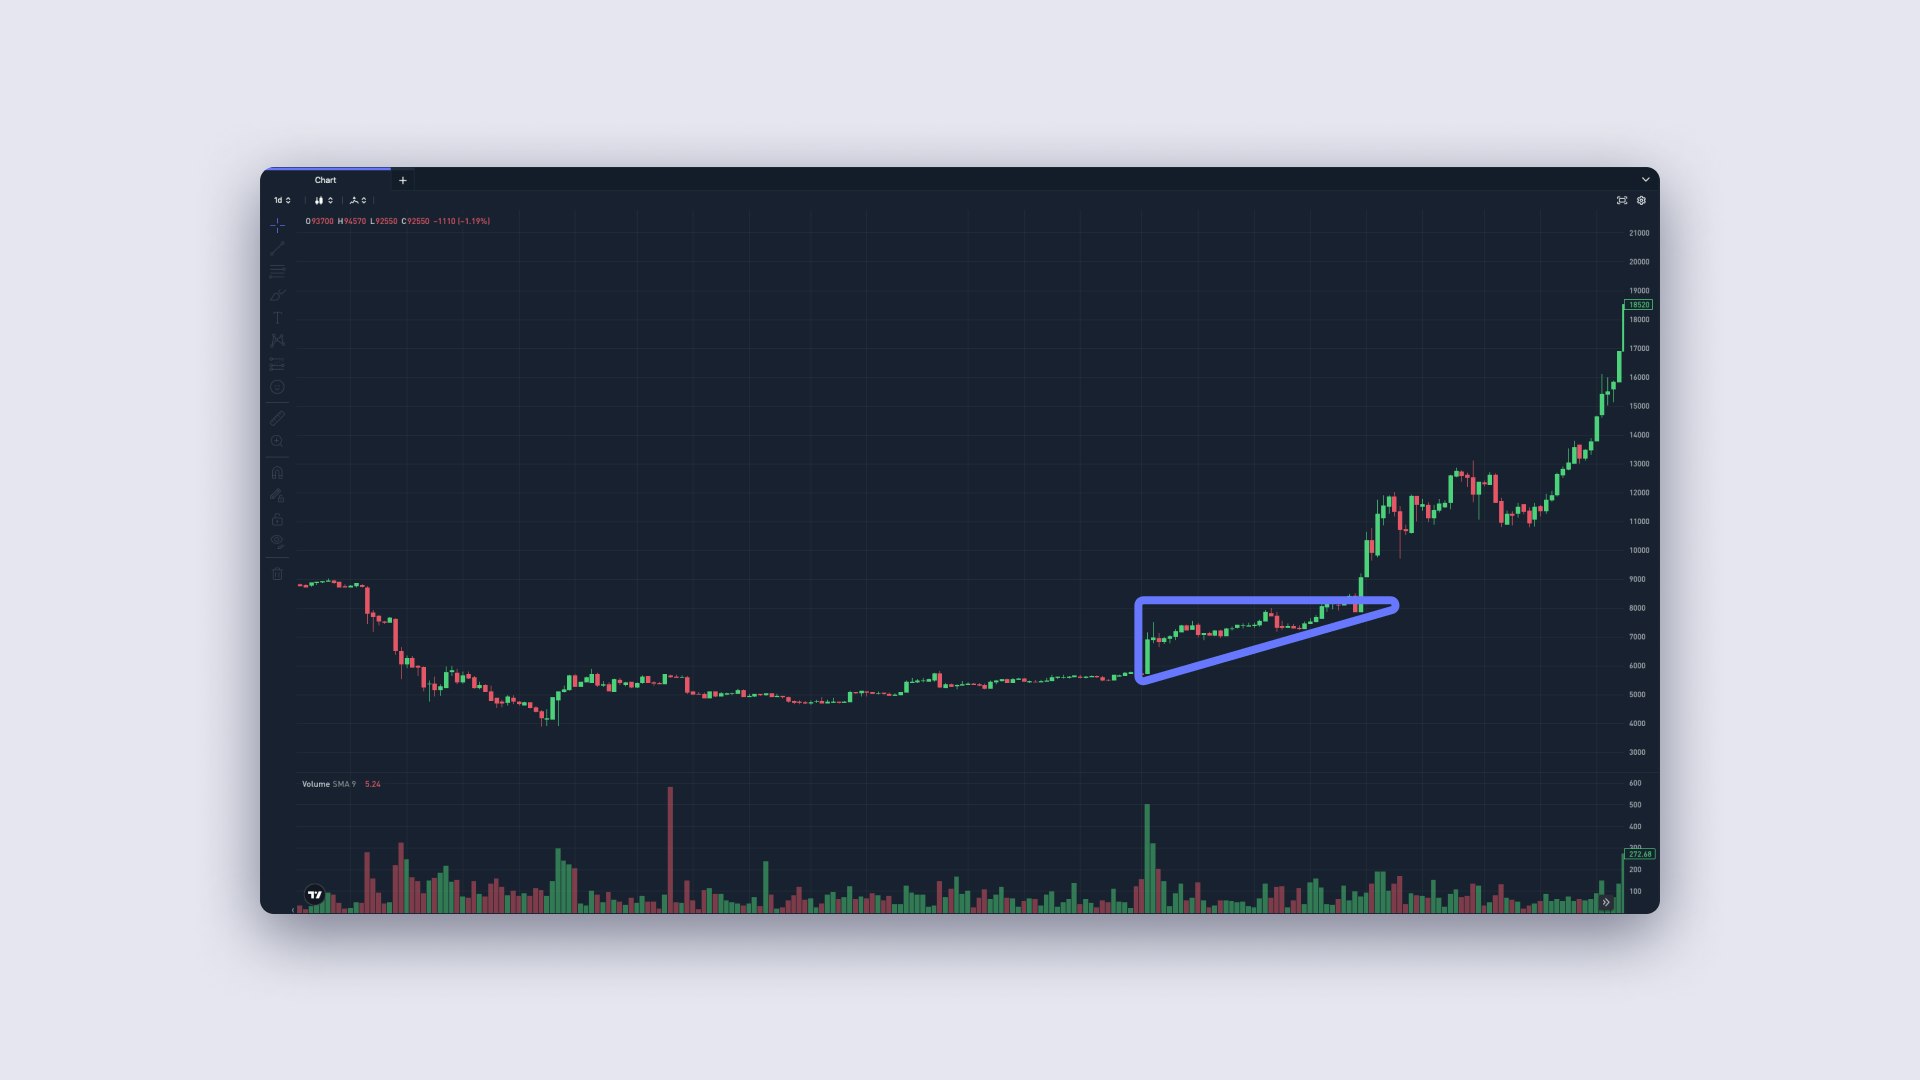
- Triangles
Triangle patterns form when price swings get tighter over time.
An ascending triangle has rising lows and a flat top, which traders usually see as bullish.
A descending triangle has falling highs and a flat bottom, which traders usually see as bearish.
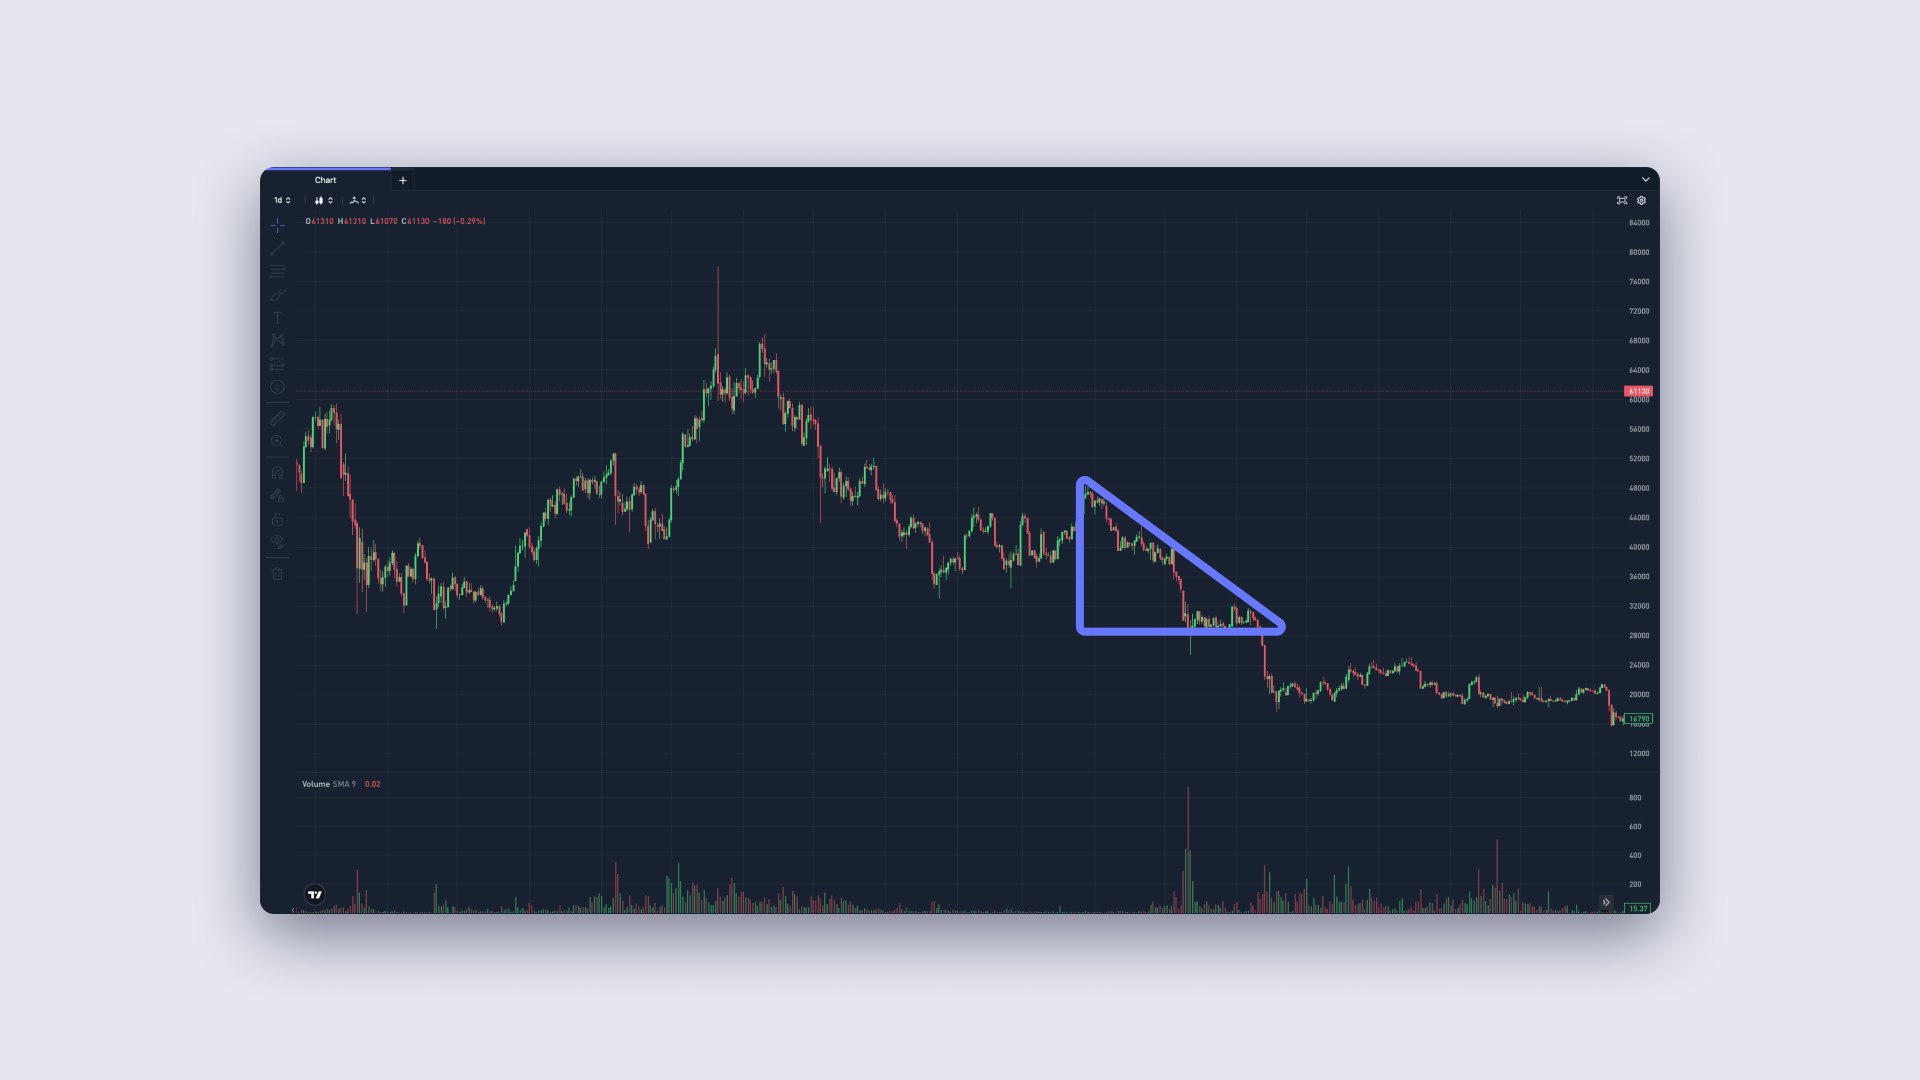
A symmetrical triangle has both lower highs and higher lows, which often signals that the market is waiting for a breakout in either direction.
How it works in practice
Technical analysis is similar to checking a weather forecast before a road trip. You know the forecast is not perfect, but it gives you better odds than guessing.
In crypto, a trader might open a daily candlestick chart for a specific token priced in USD. They see that price is moving up toward a known resistance level that rejected price twice before.
They look at the RSI and see a reading of 75, which suggests the token is overbought. At the same time, trading volume is starting to fall even though price is still rising.
Putting these clues together, the trader decides that the move may be losing strength. Instead of buying right under resistance, they wait for a pullback toward a previous support level with stronger volume.
Risks, red flags, and how to stay safe
Technical analysis is not magic. It does not remove risk, and it will not turn every trade into a win.
It is only one tool in a much larger trading and investing process.
-
False signals
Indicators and patterns sometimes suggest a breakout or breakdown that never follows through.
For example, price can break above resistance, then quickly reverse, trapping traders who rushed in. This is often called a “fakeout”. -
Ignoring fundamental analysis
Charts do not show project upgrades, security issues, regulatory changes, or big macro events in the US or elsewhere.
A strong chart can fail if bad news hits, and a weak chart can improve fast after positive news. It is safer to combine technical and fundamental views. -
Emotional trading
Fear and greed often hurt traders more than any single chart pattern.
Fear of missing out can push you to buy at the top of a fast move. Panic can cause you to sell near the bottom. A written plan and clear rules can help you stay calm. -
Poor risk management
Even the best setup can fail. That is why position sizing and risk controls matter.
Many traders use stop loss orders, which automatically close a trade if price drops to a certain level.
As a general rule, do not risk more money than you can afford to lose, and be very careful with leverage or margin. A single bad trade with high leverage can wipe out your account.
Why technical analysis matters
Technical analysis is just one part of crypto trading, but it gives people a shared language for discussing price action.
Whether you are running a trading bot, or buying your first small altcoin with $50, chart skills can help you make more structured decisions.
Instead of guessing, you rely on trends, support and resistance, and momentum indicators to guide your timing. You will still have losing trades, but over time, a consistent approach can help you avoid emotional decisions and manage risk more effectively.
By learning the basics of technical analysis and combining them with your own research, you build a toolkit that can help you navigate crypto’s constant volatility with more confidence and control.

CoinJar
CoinJar is one of the longest-running cryptocurrency exchanges in the world. Since 2013, we’ve helped hundreds of thousands of people worldwide to buy, sell and spend billions of dollars in Bitcoin, Ethereum and dozens of other cryptocurrencies.
Read full bio