Key Takeaways
- Technical analysis means studying past price charts and trading volumes to form a view about possible future market movements.
- Traders use indicators and visual chart patterns to highlight potential buying or selling areas, not guarantees.
- Charts alone are not enough. Responsible traders combine technical tools with clear risk management rules and an understanding of the wider market.
Technical analysis is the study of historical market data, mainly price and volume, to make informed guesses about future price movements. Instead of focusing on a crypto-asset’s technology, team, or use case, technical analysis assumes that the current price already reflects all publicly known information.
By reading charts, you try to understand how other market participants are behaving. Over time, certain price patterns have appeared often enough that traders watch for them as potential signals. These signals are never certain, but they can help you structure your decisions.
The foundation of market analysis
Modern technical analysis dates back to the late 19th century and the work of Charles Dow, who created the first stock market index. His ideas later formed what is known as Dow Theory, which rests on several core concepts.
First, the market discounts everything. In simple terms, the current price of an asset reflects the combined views and information of all buyers and sellers at that moment.
Second, markets move in trends. Prices can rise over time in a bull market or fall over time in a bear market. These trends often continue until clear signs of change appear.
Finally, volume helps confirm trends. Rising prices with strong trading volume can suggest solid momentum. Rising prices with weak volume can indicate that a trend is fragile and may be at risk of reversing.
Types of crypto-asset charts
Before you can analyse the market, you need to understand how price data is shown on a chart. Traders look at crypto prices across different time frames, from one-minute moves to multi-year trends.
There are a few common chart types.
Line and bar charts
A line chart is the most basic type. It usually plots the closing price of an asset over time. This makes it easy to see the general direction of the trend.
A bar chart provides more detail for each time period. Each bar shows the opening, highest, lowest, and closing prices. This allows you to see how far the price moved within that period, not just where it finished.
Candlestick charts
Candlestick charts are the most widely used tool in technical analysis for crypto and traditional markets.
Each candlestick shows the open, high, low, and close for a given period, such as one hour or one day. The candle’s body represents the gap between the open and close. The thin lines above and below the body, often called wicks or shadows, show the highest and lowest prices reached.
Candles are usually colour coded, for example green if the price closed higher than it opened and red if it closed lower. This colour pattern helps traders quickly see who was in control during that period, buyers or sellers.
Key technical indicators
Technical indicators are calculations based on price and volume. They do not predict the future, but they can help you measure trends, momentum, and volatility in a more structured way.
Below are some of the most commonly used indicators.
-
Simple Moving Average (SMA):
This is the average price of a crypto-assets over a chosen period, such as 20 days or 50 days. It creates a single line that smooths out daily price swings, which makes the underlying trend easier to see. -
Exponential Moving Average (EMA):
The EMA is similar to the SMA, but it gives more weight to recent prices. This makes the EMA react more quickly to new price moves, which some traders prefer when markets are changing fast. -
Relative Strength Index (RSI):
The RSI measures the speed and size of recent price changes on a scale from 0 to 100. Readings above 70 are often described as overbought, which means the price may have risen too quickly and could correct. Readings below 30 are often described as oversold, which means the price may have fallen too quickly and could bounce. These are not rules, just common reference points. -
Bollinger Bands:
Bollinger Bands place two bands above and below a moving average. The distance of the bands from the average depends on recent volatility. When the price touches or moves outside the upper band, traders may see the market as stretched on the upside. When it touches or moves outside the lower band, they may see it as stretched on the downside. -
Fibonacci Retracement:
This tool uses percentage levels based on the Fibonacci sequence, such as 38.2%, 50%, and 61.8%. Traders apply these levels to a recent price move to estimate where a pullback might pause before the trend possibly continues. These levels are widely watched, which can sometimes make them self-reinforcing, but they do not guarantee a reversal or continuation.
Recognising chart patterns
Chart patterns are shapes formed by price movements over time. They summarise how buyers and sellers have interacted and can give clues about possible future behaviour.
These patterns do not promise a certain outcome. They simply suggest scenarios that traders may watch for.
-
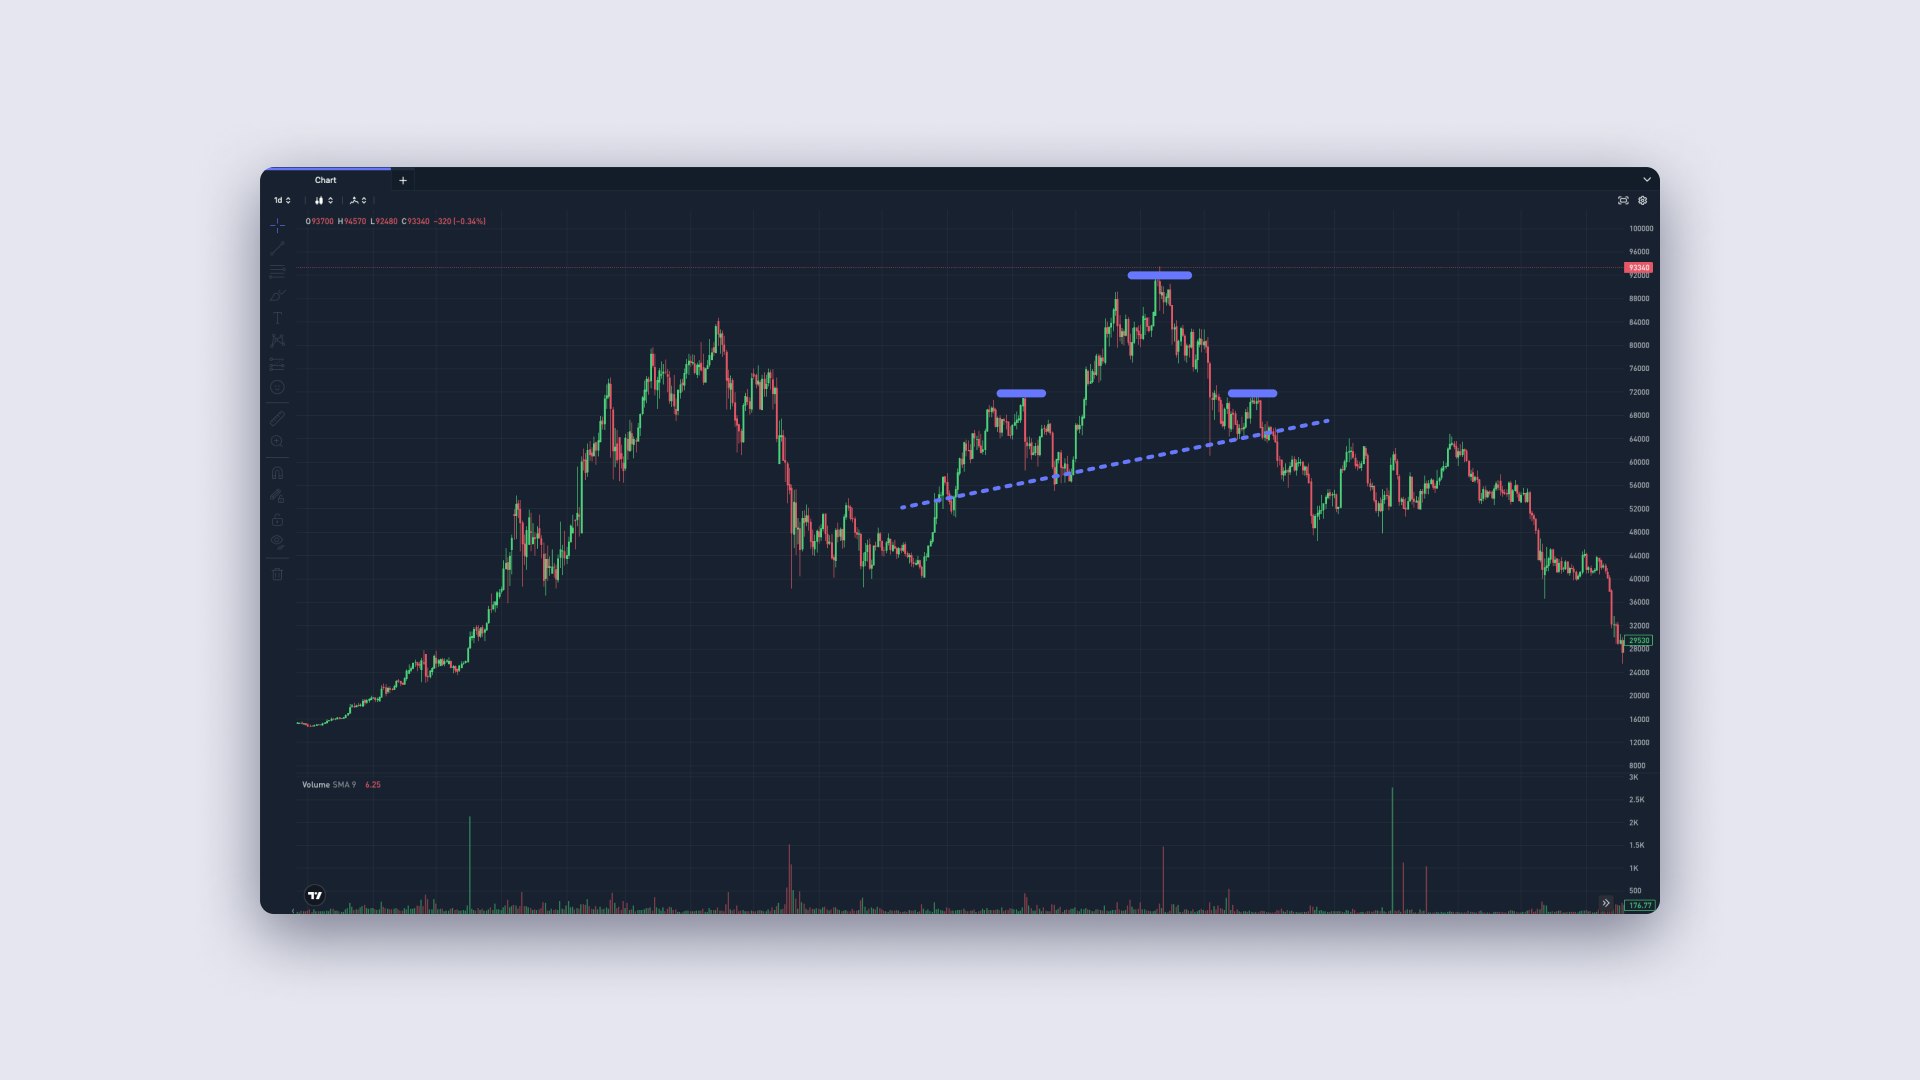
Support and resistance:
Support is a price area where buying interest has previously been strong enough to stop or slow a decline. Resistance is a price area where selling interest has previously been strong enough to stop or slow a rise. Traders often mark these levels to plan entries, exits, or stop-losses. -
Trend channels:
If you draw a line along the rising lows in an uptrend and a parallel line along the rising highs, you may create a channel. The same idea works for downtrends. Channels help traders see the normal range of movement and spot possible breakouts above or below that range.
-
Head and shoulders:
This pattern looks like three peaks, with the middle one higher than the other two. In an uptrend, a completed head and shoulders pattern can signal a potential shift from rising prices to falling prices. The inverse version, called an inverse head and shoulders, can appear at the end of a downtrend and may signal a possible move higher. -
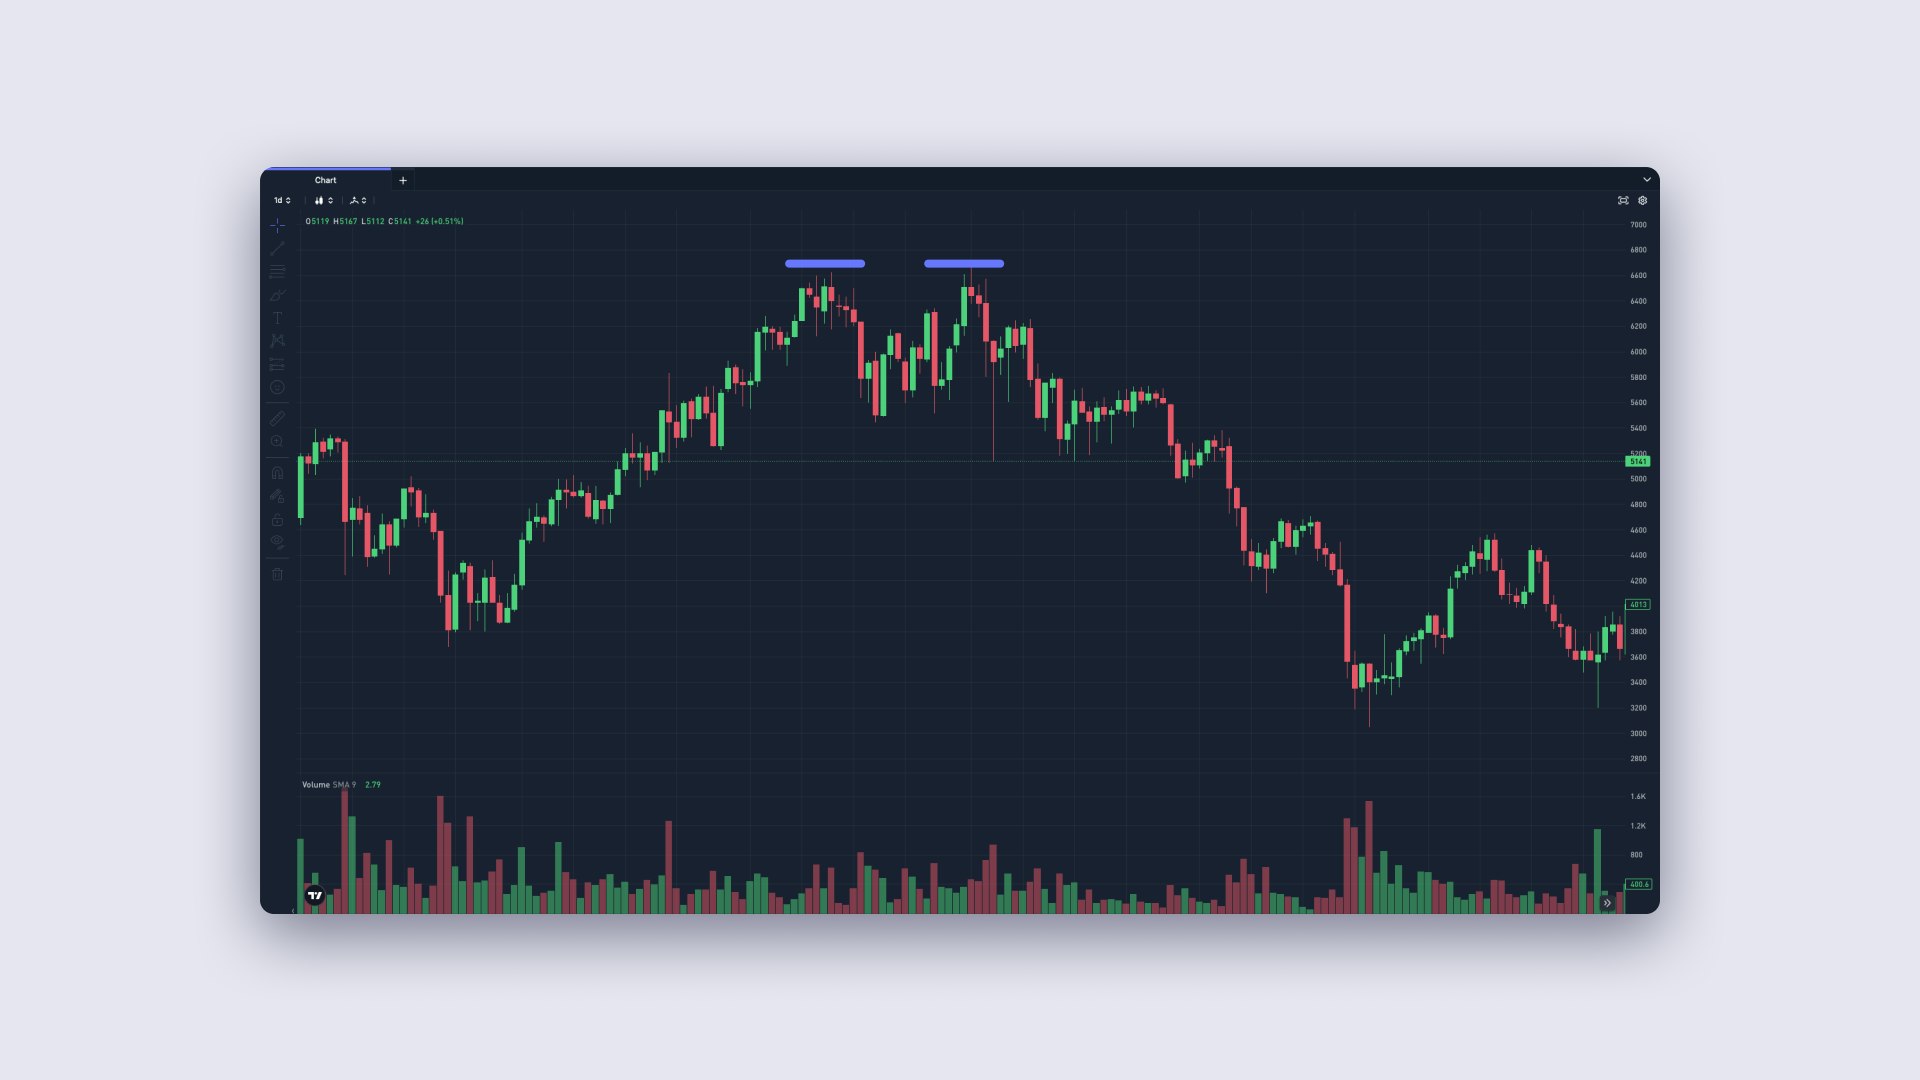
Double top:
A double top forms when the price reaches a similar high level twice but fails to break above it. It roughly looks like the letter M. This can suggest that buyers are struggling at that level, and a downward move may follow.
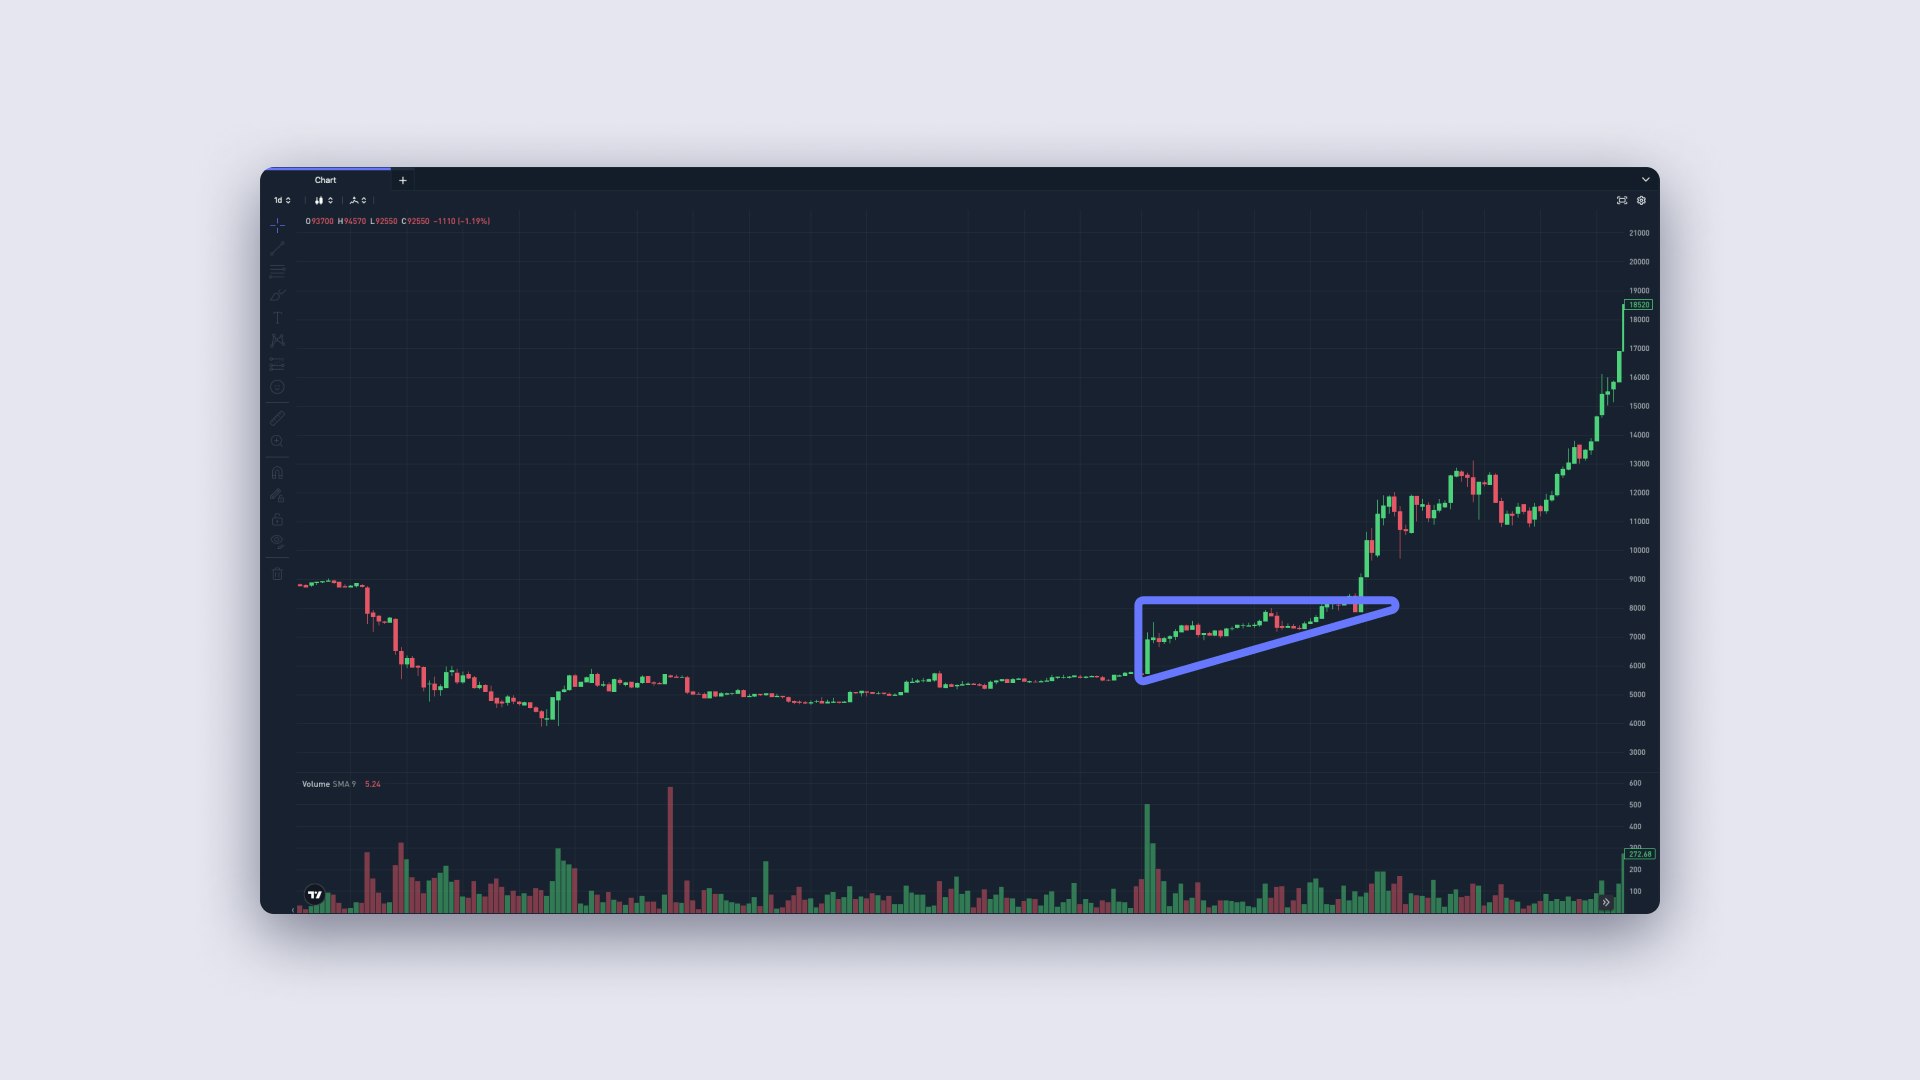
- Triangles:
Triangle patterns appear when price swings become gradually narrower.- An ascending triangle has a flat resistance line at the top and rising lows at the bottom. It often reflects stronger buying pressure.
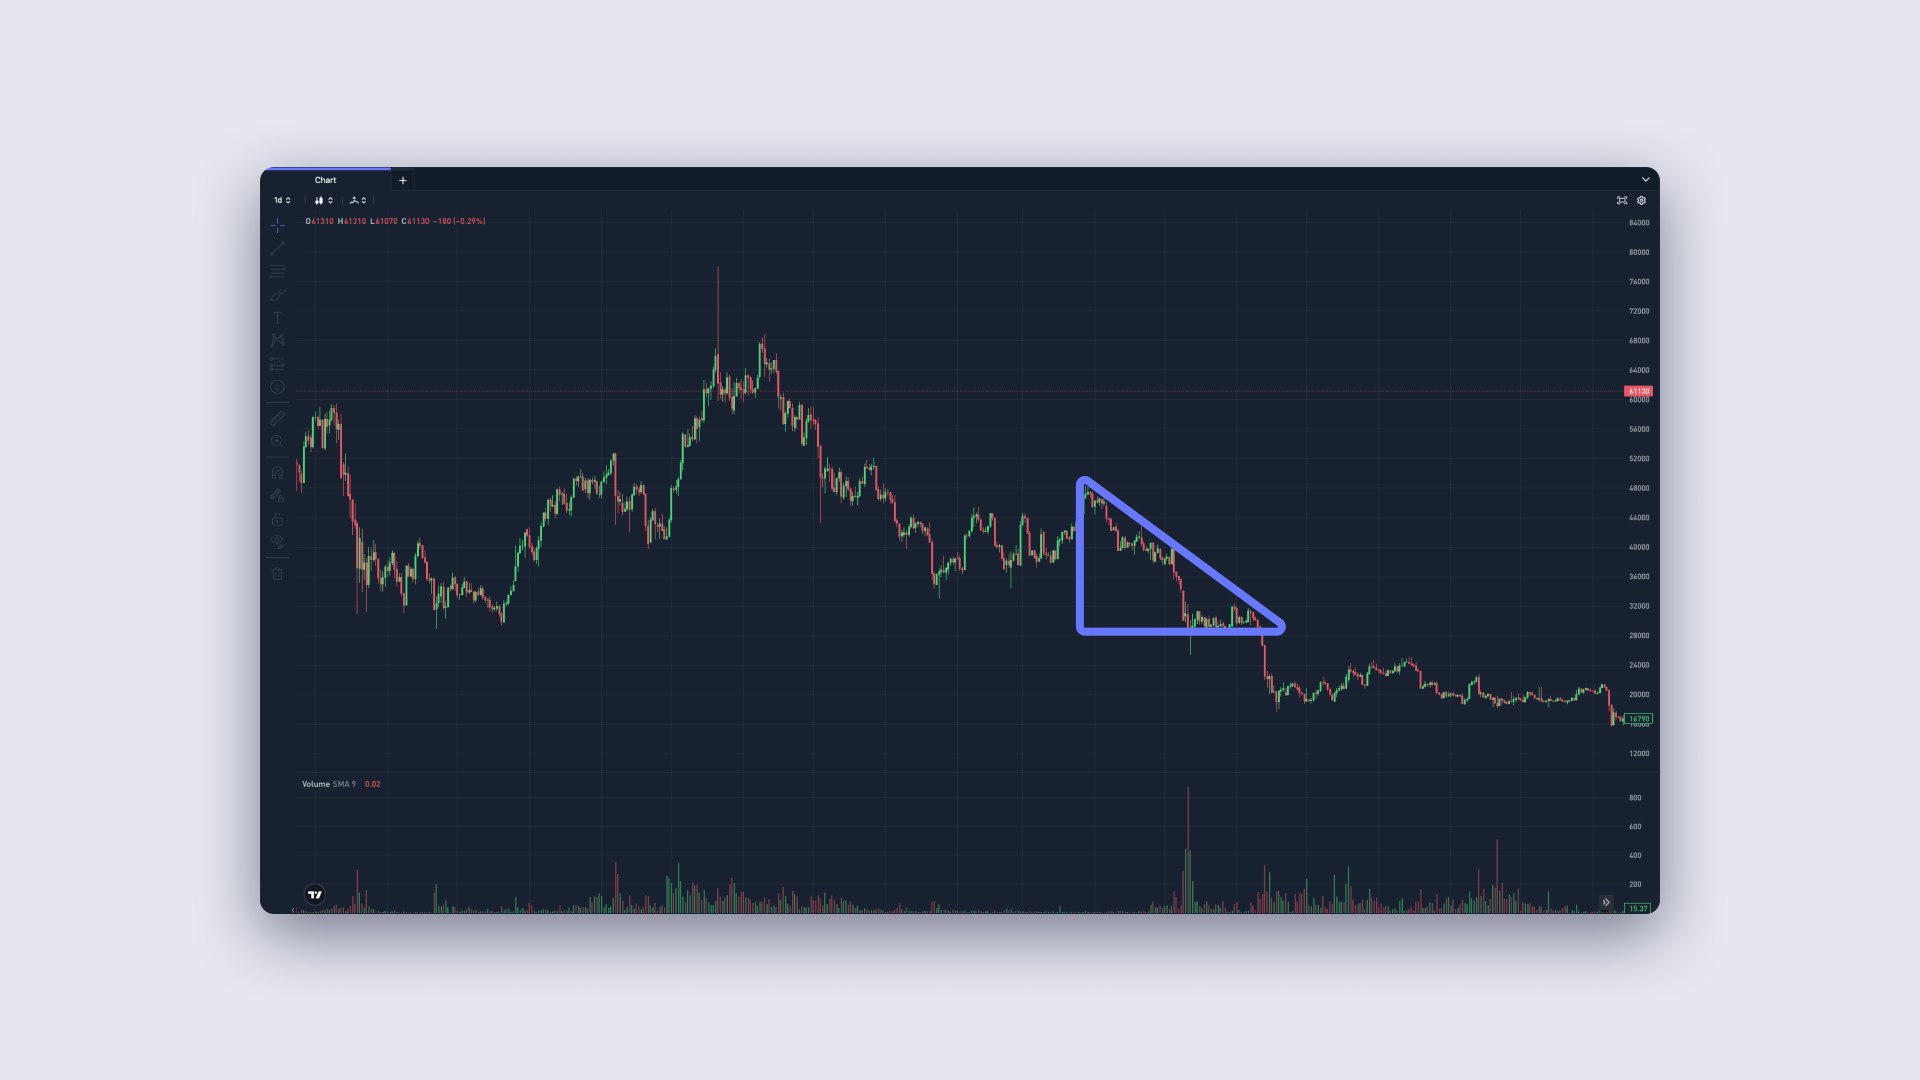
- A descending triangle has a flat support line at the bottom and falling highs at the top. It often reflects stronger selling pressure.
- A symmetrical triangle has both rising lows and falling highs. It usually represents a period of balance before a larger move in either direction.
How it works in practice
You can think of technical analysis like checking the weather forecast before a trip at sea. You study wind patterns, pressure changes, and past weather to make a better plan, but you still know that conditions can surprise you.
In the crypto market, a trader might open a daily candlestick chart for a particular token trading at around €2.00. They see that the price is approaching a resistance area where it has turned lower several times before.
They then check the RSI and see a reading above 70, which suggests short-term overbought conditions. At the same time, they notice that trading volume is falling even as the price edges higher.
By combining these observations, the trader may decide that the upward move is weakening. Instead of buying at that point, they might wait for a pullback towards a known support level, for example around €1.70, before considering a position. This is not a guaranteed better entry, but it is a more structured approach than guessing.
Risks, red flags, and how to stay safe
Technical analysis is not a prediction tool and it does not remove risk. It can help you organise your decisions, but it will not make every trade profitable.
Here are some key risks to watch for.
-
False signals:
Indicators are based on maths, not on future events. They can suggest a breakout that fails or a reversal that never happens. For example, a move above resistance might look strong, then quickly reverse if broader market sentiment changes. -
Ignoring fundamental analysis:
Charts do not fully reflect upcoming events like protocol upgrades, security issues, regulatory changes, or major macroeconomic news. For crypto-assets, it is important to understand the project, tokenomics, team, and legal status, not just the price path. -
Emotional trading:
Fear and greed can quickly override any trading plan. Fear of missing out can push you to buy after a rapid price jump. Fear of loss can tempt you to sell at the bottom of a sharp drop. Technical tools are most useful when you follow them calmly and consistently. -
Poor risk management:
Even a strong technical setup can fail. To manage this, traders often use stop-loss orders to limit how much they can lose on a single trade. For example, you might risk only 1% to 2% of your total trading capital on any single position. It is generally sensible to avoid using high leverage, especially when you are new or relying mainly on chart patterns.
Why technical analysis matters
Technical analysis is only one part of evaluating a crypto-asset, but it is a common language among traders worldwide. Whether you are an automated trader handling large volumes or an individual buying your first €100 of a token, chart skills can help you structure your decisions.
Used carefully, technical analysis can shift trading away from pure guesswork and towards a set of testable rules. It helps you think in terms of trends, key levels, and momentum, instead of headlines and social media hype.
To use it responsibly, combine basic chart reading with an understanding of the asset, the legal and regulatory environment, and your own risk tolerance. This way, technical analysis becomes one tool in a broader decision-making toolkit, not the only thing you rely on.

CoinJar
CoinJar is one of the longest-running cryptocurrency exchanges in the world. Since 2013, we’ve helped hundreds of thousands of people worldwide to buy, sell and spend billions of dollars in Bitcoin, Ethereum and dozens of other cryptocurrencies.
Read full bio